In a previous project for a multi-tenant Rails application, we chose schemas as our tenant data separation policy. We picked this policy having looked at database, schema and row level separation policies - we liked the guaranteed separation schemas offered, the ability to backup and restore individual tenant datasets and the simpler approach regarding table indexing.
Introduction
At the time, Native PostgreSQL row level security wasn’t available and would be our go to choice today. Our setup was running on AWS using multiple EC2 instances in a load balancer to run the Rails app, API and background worker instances, and RDS for a managed PostgreSQL instance.
The Problem
Everything worked exactly as intended and post launch we were very happy with the database and infrastructure choices we made, performance was good and our clients were happy. As the product became more successful and attracted lots of new customers, naturally the number of schemas also increased. Once we got to around 2000 schemas we started to notice significant database performance degradation from time to time. Things soon hit a critical stage when the database server started to crash and restart on a regular basis.
Investigations
Our investigations discovered that database server physical and swap memory usage was always very high just prior to a crash. We couldn’t understand why memory usage was as high as it was, the server was well specified and should have had RAM to spare. While closely monitoring memory usage we could see it was pretty linear - as time passed memory utilisation increased.
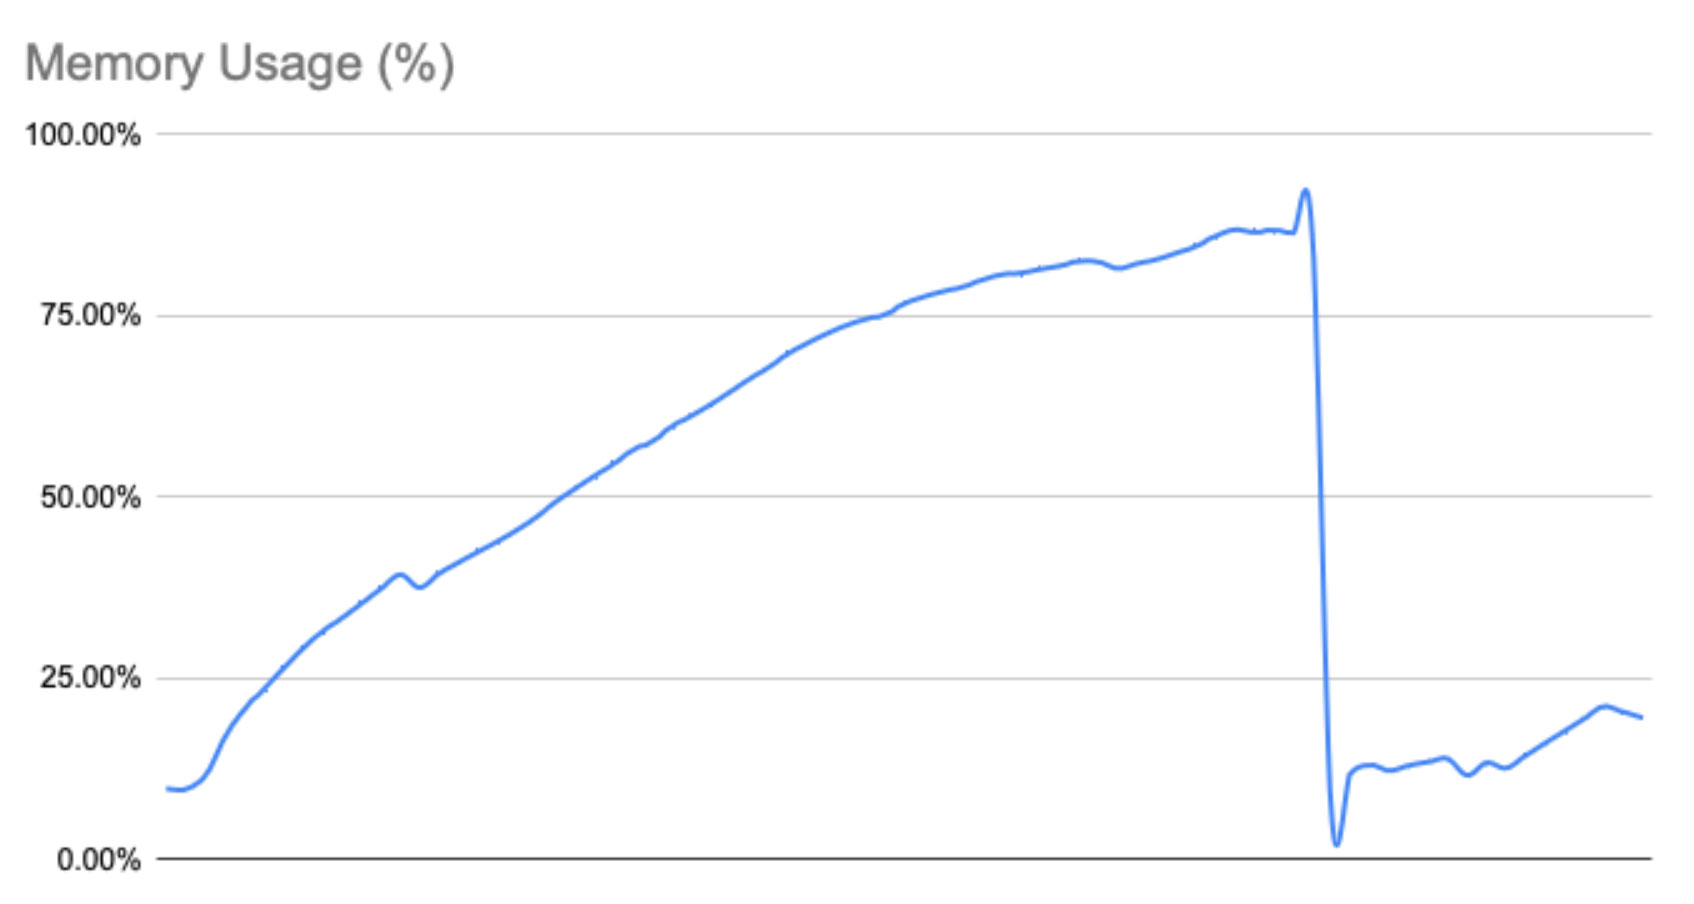
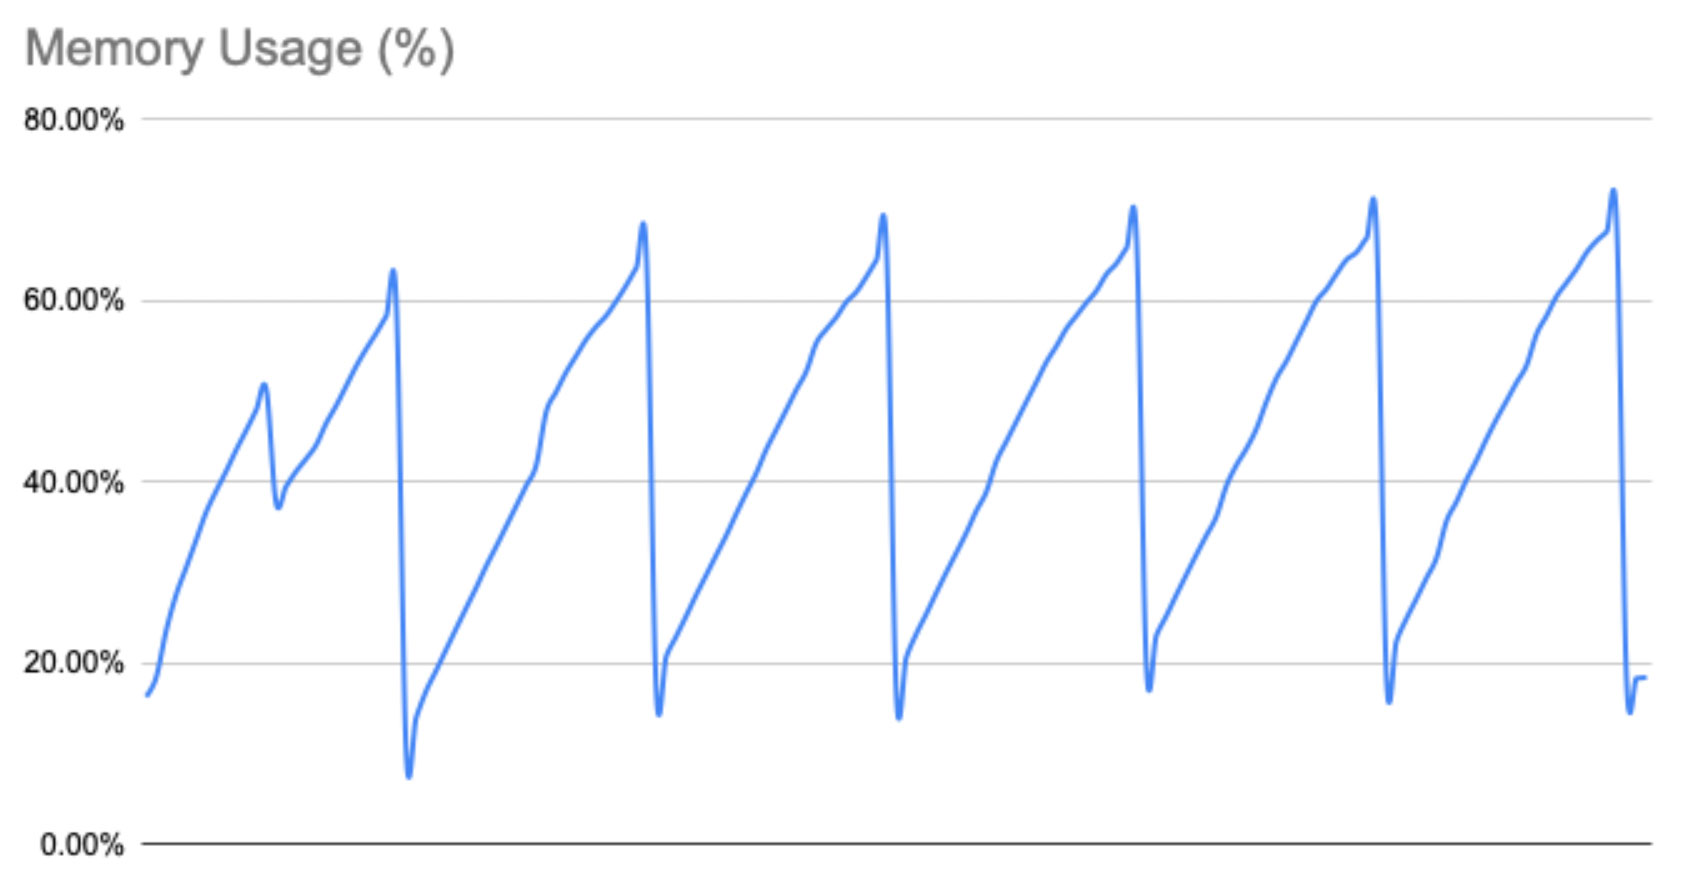
Another discovery to surface during our investigation was that memory usage on the database server always dropped when we deployed new code before starting to rise again. We used a zero downtime deployment strategy that would launch new Ruby processes running the new code whilst killing the previous processes running the old. To explore this further, we started to cycle servers from the load balancer and restart them. As we did this we noticed that memory usage on the database instance also went down and then started to go back up again, just like during a deploy. Repeating this process resulted in a graph of memory utilisation that looked like a sawtooth. Both of these discoveries clearly showed that as connections to the database server were closed and reopened it resulted in memory being freed up. Why? What was this memory being used for?
Conclusions
When a PostgreSQL connection receives requests it will keep a cache of metadata about the database schema’s objects (tables, columns, indexes, views, etc.) it has touched during its lifetime. This is great news from a performance perspective and what you’d probably expect from a good database server. Critically, however, there are no constraints on the amount of memory that can be used for this purpose.
The consequence of this is that as the number of schemas, objects and connections increase, so will the memory utilisation for object metadata caching. As there is no limit to the amount of memory that can be allocated there will come a critical point where the required metadata cache exceeds available memory, therefore the database server will ultimately consume all available system and swap memory to the point that the database instance processes will be killed by the operating system.
This issue will manifest when a database has a very high number of schemas/objects/connections, a simple formula will give you an understanding of the total potential size of a metadata cache: -
((schemas * objects) * connections) = cache entries
In our case with around 2,000 schemas, each with 3,500 objects, and 40 database connections resulted in approximately 280 million potential cache entries over time. The byte size of a cache entry is variable, but with an estimated average of 128 bytes each that would equate to around 36GB of memory requirement. With no limits imposed on the amount of memory used by PostgreSQL for caching metadata, combined with connections that are long-lived, this size of cache will result in memory exhaustion in most typical server configurations.
The Solution
Knowing that closing the connection resulted in PostgreSQL freeing that connection’s cache memory we experimented with some code that would close and reconnect the database connection every few thousand requests. Doing this limits a connection’s lifetime and therefore the size its object metadata cache can grow to.
With this code deployed to all servers we saw a sawtooth pattern in the memory utilisation as memory was consumed and then released, but crucially, memory utilisation was now under control. Whilst the connection reset took around 500ms, we saw no meaningful performance penalty across the stack (acknowledging that the request that triggered the reset would be slower than usual) and our database server was now on a much more reliable footing.
We always intended that this code change would be temporary whilst we worked out a more permanent solution, however, further reading and investigation revealed that the memory exhausting cache behaviour was “normal” and there was no other applicable solution than the one we had implemented. As a result, this code remains in place to this day doing an excellent job in keeping metadata cache memory utilisation in check.
An alternative approach to resetting the connection in code would be to use a connection pooler (e.g. PGBouncer) that can be configured to control the maximum lifetime of a connection.
Demonstration
To demonstrate this behaviour we’ve built a simple Ruby on Rails application that uses a Docker Compose file to provision a PostgreSQL server instance with a 2GB memory limit. This app has a database migration that will create 3,000 schemas populated with a real world set of tables (taken from FatFreeCRM) and has a rake task that will trigger the memory exhaustion issue by performing a select command on each table in each schema. The same rake task can be run with a connection reset every 500 schemas, demonstrating that this approach avoids memory exhaustion.
https://github.com/CircleSD/pg_object_cache_test
Get in touch
At Circle Software & Design we offer a range of software development services to help with the running and performance of your ruby on rails applications. These services consist of; consultancy, maintenance, upgrades or additional development resource to temporarily add into your development team to help with the technical challenges your business is facing. With over 25 years building software development applications, chances are we’ve travelled down your road before and are on hand to help offer guidance and make changes to improve the running of your application. Get in touch with us today on hello@circle-sd.com or via our contact form to see how we can help.